A mathematical guide to Mount Inflection’s research, portfolio decisions, newsletters and live operation.
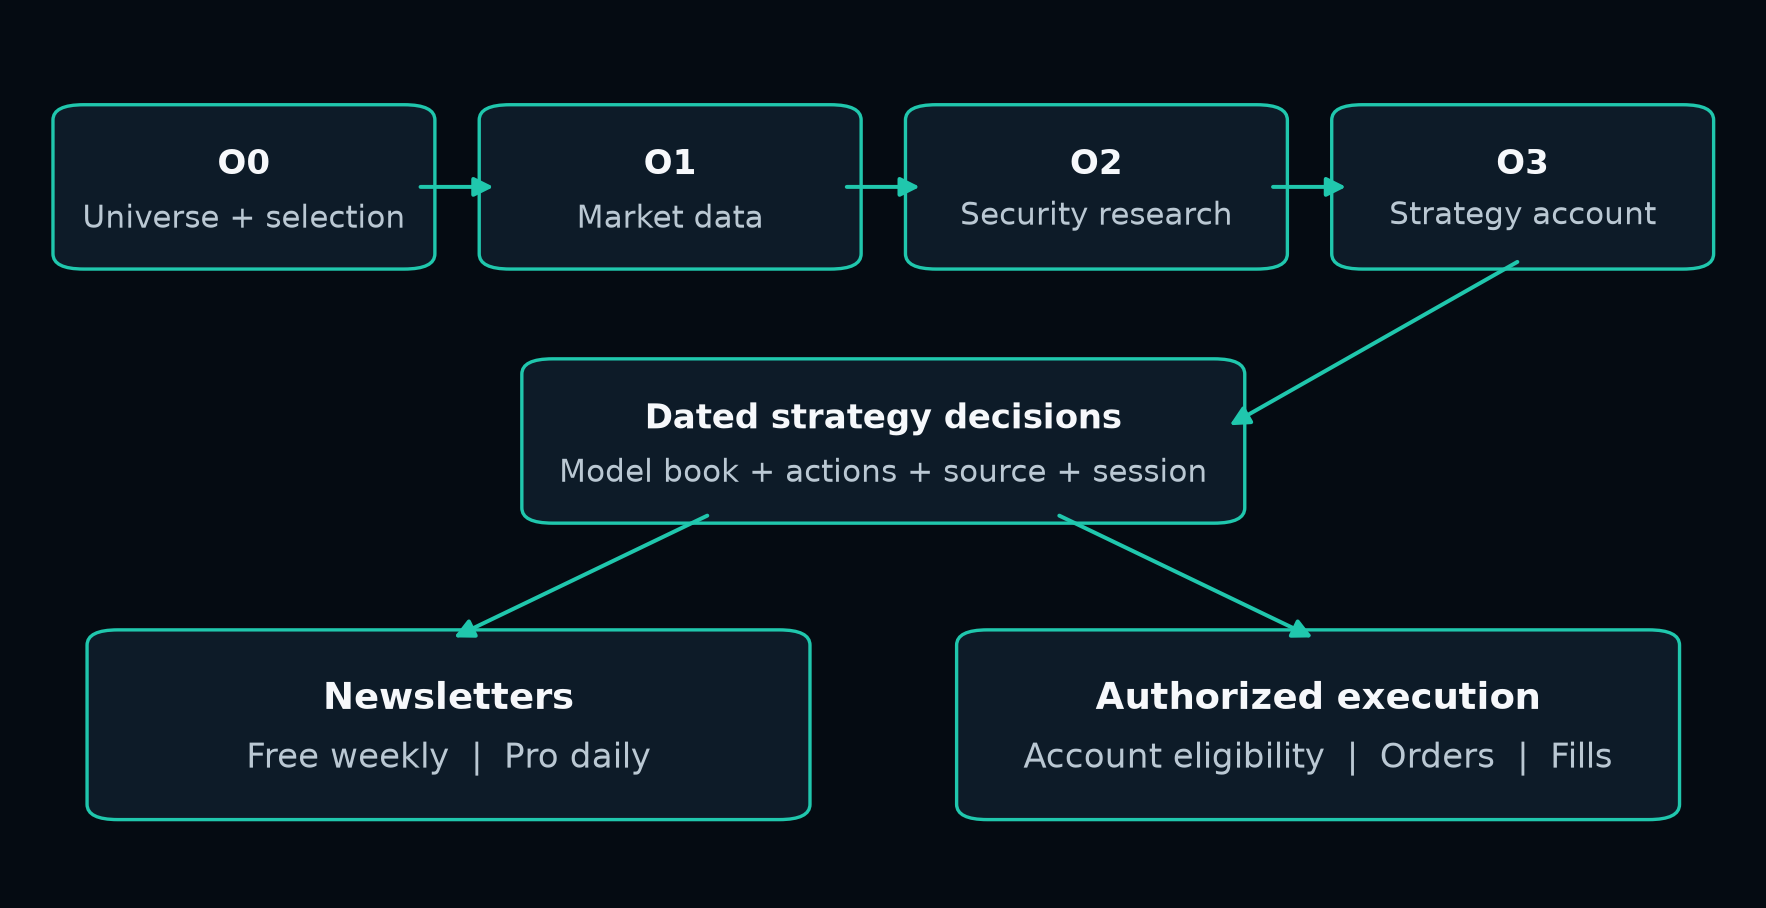
The complete operating chain: security research becomes a dated strategy decision, then supports reader communication and separately authorized execution.
Start with the signal names: NT codes describe buy/entry signals; PT codes describe sell/exit signals. The paper explains these signal families, then connects them to portfolio selection, newsletters and execution. A signal is research evidence; the strategy decides whether it becomes a model action.
Mount Inflection | Revised November 6, 2026. Mathematical definitions and conceptual representations support the explanation. Figures show mechanisms and dated operational evidence; no investment-performance series is presented.
01 / 24
THE COMPLETE SYSTEM
From a price move to a running strategy
A stock can show improving momentum without becoming a holding. It can become a model holding without being held in a particular brokerage account. It can be published as a new decision while an execution restriction prevents an order. Explaining those transitions is essential to understanding the strategy.
The model account is a continuing research book of holdings, cash and pending decisions, separate from a brokerage account. O3 maintains that book. Its dated decisions support the Free/Pro issues and, under separate authorization, eligible account actions.
Responsibility
Question answered
O0 - Universe and selection context
Which security sets, cohorts and selected sources supply this review?
O1 - Market data
Which completed observations have passed identity, timing and history checks?
O2 - Security research
What do features, ranks, entry/exit evidence and trade history say about each opportunity?
O3 - Strategy and model account
What should the Free or Pro model retain, exit or admit, given its policy and existing book?
Newsletters
What changed, what is held, which dates apply and what does the reader need to understand?
Authorized execution
Which eligible actions can this account submit, and what did the broker actually fill?
How to read the mathematics
Equations define standard quantities or represent the relationship between stages. They operate at the level of information, state and accounting. The NT/PT atlas explains the reviewed signal concepts; a code’s presence alone does not establish its frequency, effectiveness or use by every strategy component.
Cross-sectional momentum compares an asset with other assets; time-series momentum studies an asset relative to its own history. Jegadeesh and Titman document the former in equities [1]. Moskowitz, Ooi and Pedersen study the latter across futures and forward markets [2]. These studies motivate a research question; they do not validate MI, its parameters or its execution.
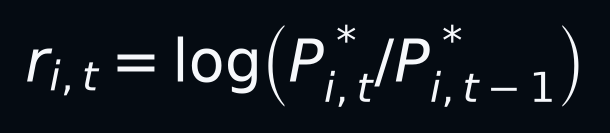
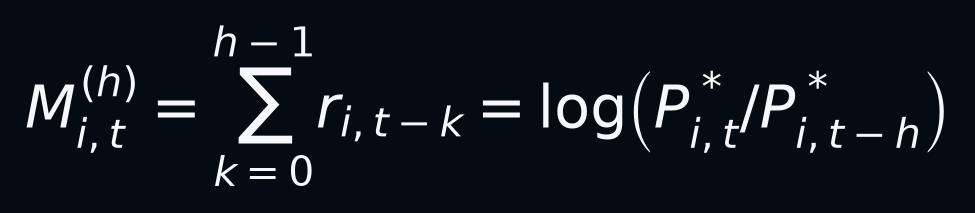
Log return of a positive research-price series. The adjustment convention determines how splits and distributions enter the history; brokerage fills and share quantities are recorded separately.Summing consecutive log returns produces the log price change over the declared horizon h. This telescoping identity connects local observations to a longer movement.
A cross-sectional rank orders that horizon movement across an eligible universe at the same time. In the textbook illustration, rank one is the largest value and ties share a rank. The ranking says which asset moved more within that set; it does not establish a positive future return.
A conditional hypothesis
Information, positioning and flows may be incorporated over time. Competing forces include reversals, crowded positioning, transaction costs and abrupt changes in leadership. The relevant question is whether a defined process captures useful persistence after its full implementation costs and adverse outcomes.
Why risk belongs in the model
Daniel and Moskowitz document severe momentum reversals, including vulnerability around rebounds after distressed markets [3]. Long-only selection and long-short momentum have different exposures. Their results cannot be treated as interchangeable, and rare adverse episodes belong in the evaluation.
03 / 24
SYSTEM ARCHITECTURE
O0 → O1 → O2 → O3
Figure 1. Functional architecture. The stages share dated inputs and continuing state. The two downstream branches have distinct responsibilities and evidence.
Stage
Inputs and responsibility
Output retained
O0
Eligible security sets, continuing cohorts and the selected vintage/component context.
Dated universe and selection.
O1
Required histories for candidates and positions that still need monitoring.
Admitted observations and provenance.
O2
Admitted data with each security’s relevant state and history.
Features, ranks and lifecycle evidence.
O3
Selected inputs, security evidence and the applicable strategy/account policy.
Model book, pending actions and dated changes.
Next
Publish the decision record and evaluate separately authorized account actions.
Issues, execution records and reconciliation.
The arrows show the main dependency, not every module call. O0 supplies selected source context; O3 applies strategy policy to that context. Existing positions may remain in the compute set after leaving the new-candidate universe because their exits still require evaluation.
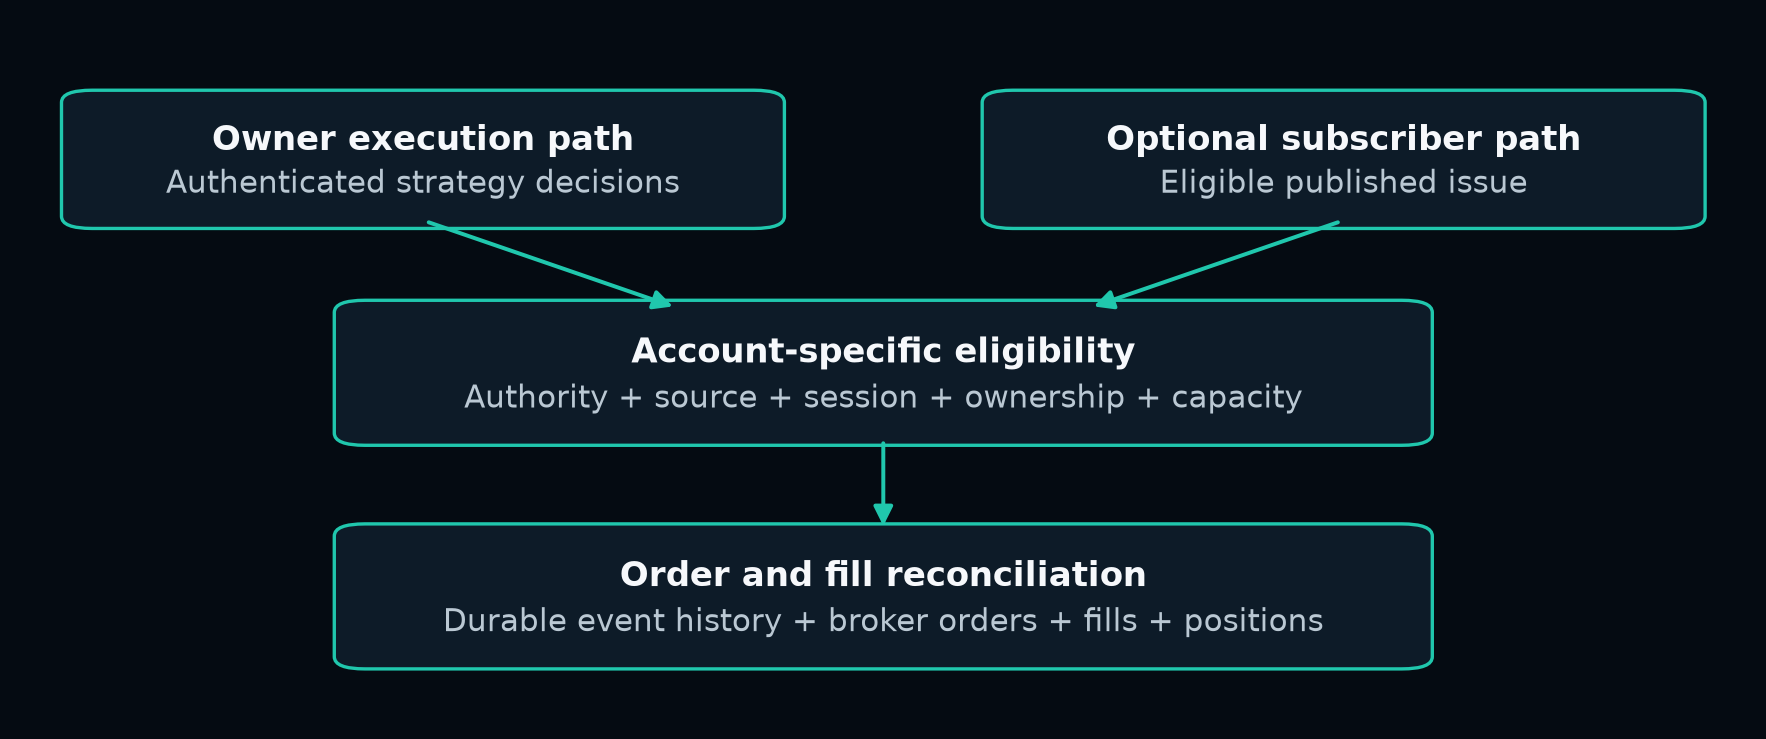
Optional subscriber automation reads eligible published issues. The documented owner execution path can consume authenticated strategy decisions directly; it does not require a newsletter resend.
04 / 24
O0 | UNIVERSE AND SELECTION CONTEXT
The universe is part of the strategy
Universe formation determines which opportunities the system can see and which risks it can accidentally hide. Eligibility should be recorded at the decision date, with security identity, usable history, liquidity and structural qualifications assessed under the relevant version.
Eligibility-set notation. S is the dated security inventory; A denotes admissible identity/instrument, Q sufficient data quality, and L liquidity/structural eligibility.
Identity is economic, legal and temporal
A ticker is a label that can change. Share classes, depositary receipts, warrants and debt instruments are not automatically substitutes. A symbol spelling alias must not become permission to replace one security’s history with another. Any policy allowing multiple legitimate share classes must be versioned separately from duplicate-record removal.
Persistence rather than one attractive observation
The MI universe design considers sustained structural suitability and usable history. It also preserves the relevant cohort and selected-source context supplied to the strategy layer. Membership changes follow the policy and information available at their actual maintenance dates. Research eligibility and trade eligibility remain different decisions.
The historical audit
A credible historical study must address delisted securities, identity changes, incomplete histories and exclusions. A broad scanner running today does not prove a point-in-time reconstruction of the past. Record why a name was excluded and when the exclusion became knowable.
05 / 24
O1 | MARKET DATA
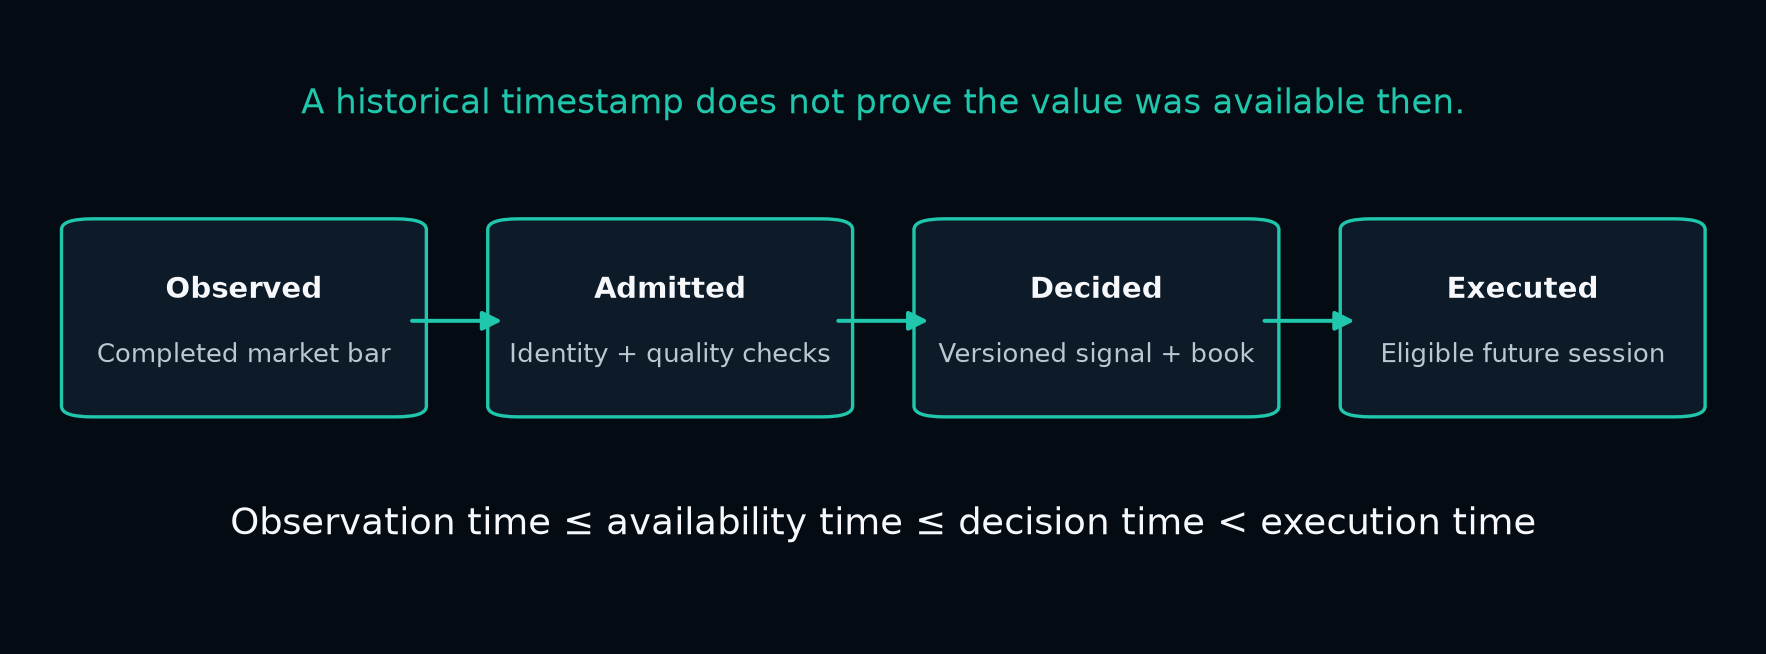
Data must be available, not merely dated
Figure 2. The causal clock. Later corrections and unfinished bars cannot silently become information available to an earlier decision.Causal ordering for the completed-observation workflow described here. Execution remains subject to the action-specific permitted session.
O1 is the admission boundary for observations. It establishes the security, session, completed-bar status, price and volume integrity, corporate-action treatment, source lineage and permitted historical revisions before downstream calculations use them.
Adjustment consistency
Adjusted research prices and broker share quantities are different objects. Splits, dividends and other actions require a declared convention and reconciliation. A mathematically smooth return history can still be wrong if a cash distribution is double counted, a split is missed or the wrong security is substituted.
Local failure versus systemic failure
An isolated name with questionable data can be quarantined while independent healthy research continues. Missing core observations, conflicting identities or unauthenticated state can invalidate the dependent portfolio computation. A retained-state report must carry its true date and cannot create current trading authority.
The running MI workflow uses completed observations, bounded readiness and recovery, and authenticated checkpoints. Provider tolerances and fallback rules are version-specific operating controls.
06 / 24
O2 | SECURITY RESEARCH
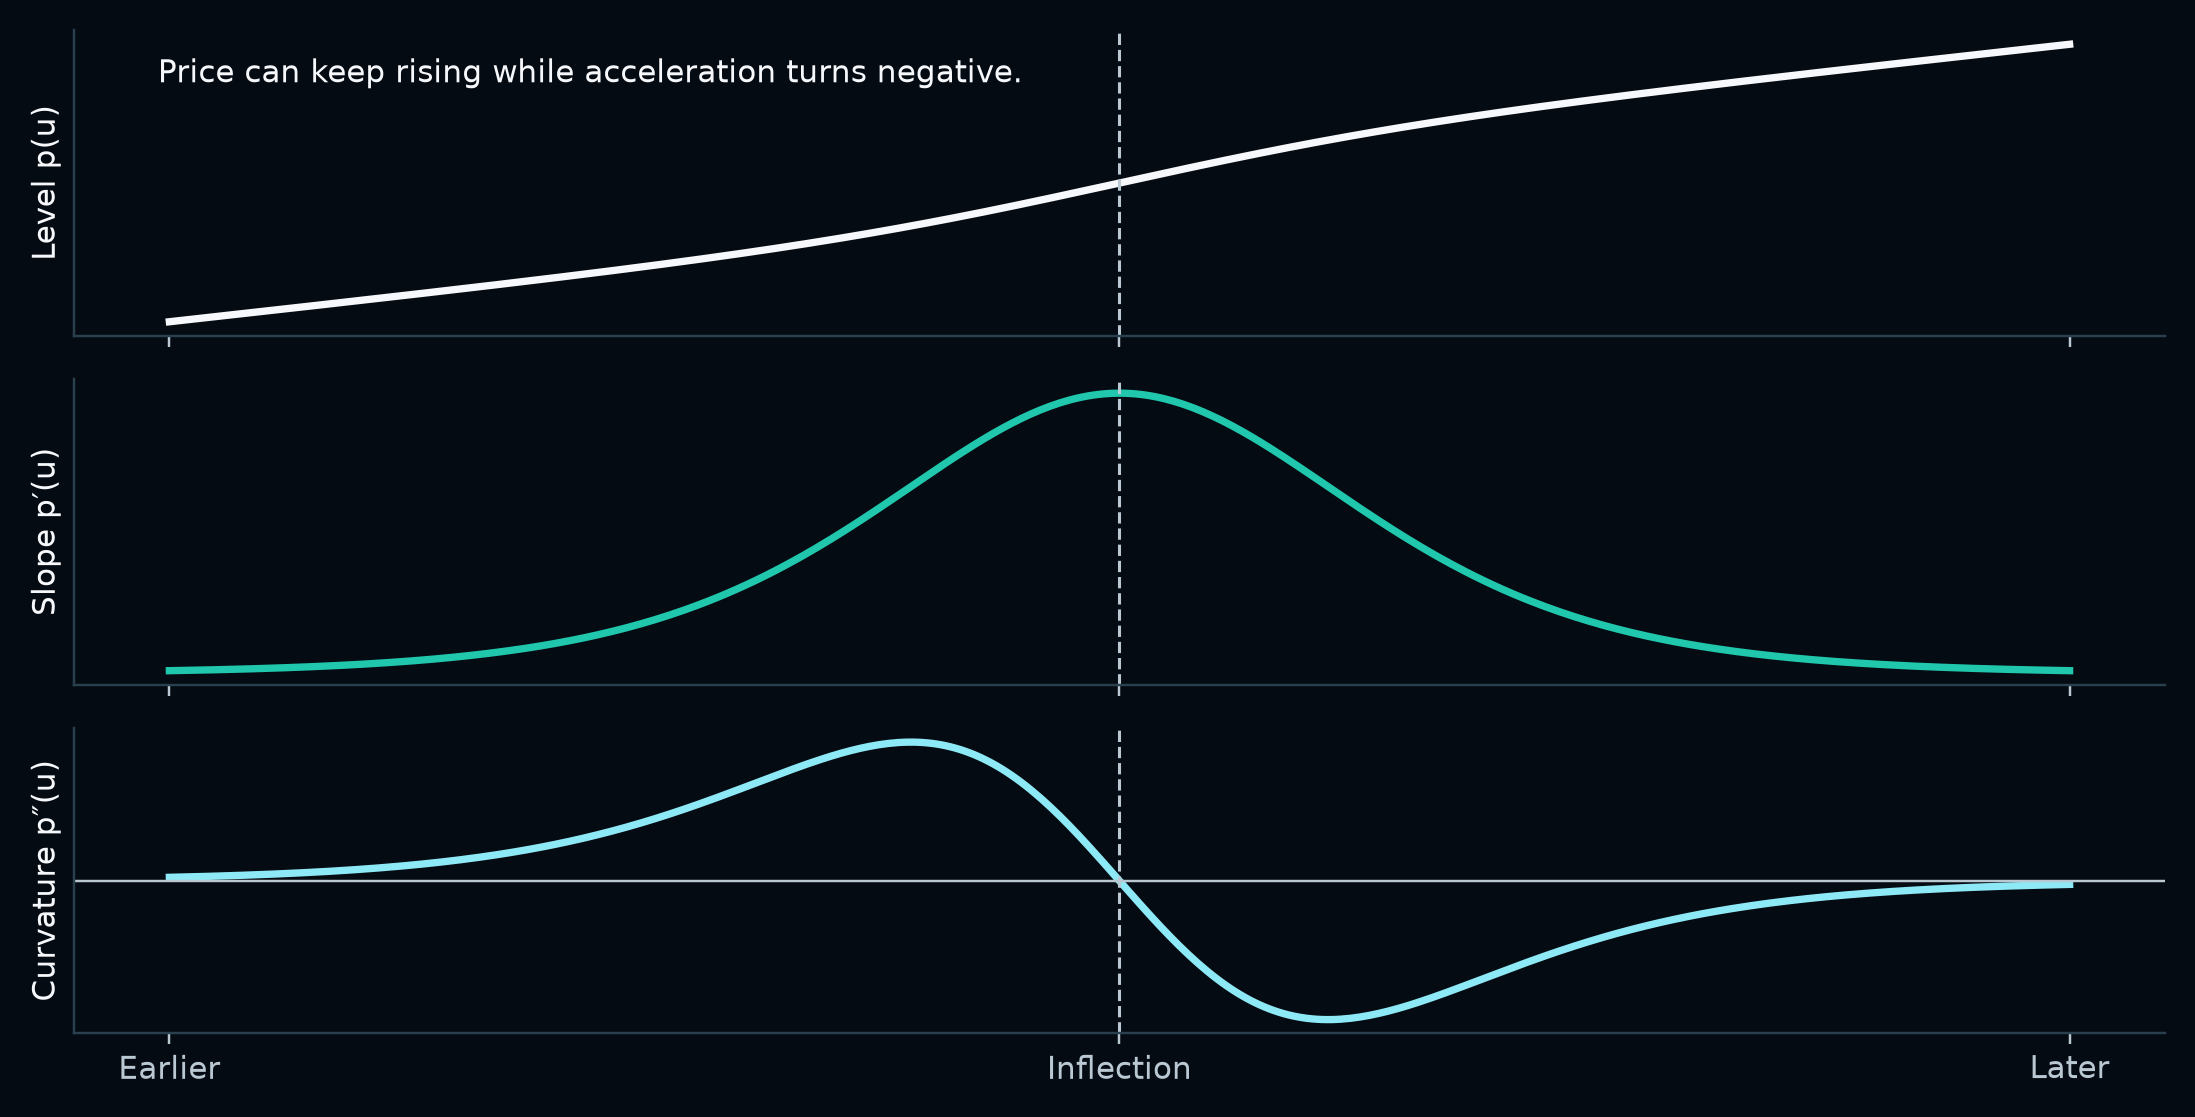
Level, momentum and inflection
Figure 3. Analytical schematic: p(u) = u + tanh(u), with its first and second derivatives. Arbitrary units; no market observations, fitted strategy or investment performance.A mathematical lens on momentum: tilde-p is a log-price sequence smoothed causally. Its first difference describes direction; its second describes changing strength. Positive momentum with negative acceleration means the series still rises, but more slowly.
Level describes where price is; momentum describes directional movement; acceleration describes how that movement is changing. A positive trend can lose acceleration before price falls. A negative trend can improve before it becomes positive. Those differences help explain why recovery, reclaim and continuation entries are distinct ideas.
The schematic separates a rising level from strengthening or weakening movement. A trading decision also needs structural context, reference levels, prior events and portfolio state.
Any production smoothing must be causal at the evaluation time. A centered filter, retrospectively revised pivot or future-assisted wave label can make a historical signal appear earlier than it was observable.
07 / 24
O3 | STRATEGY AND MODEL ACCOUNT
O3 turns research into a strategy
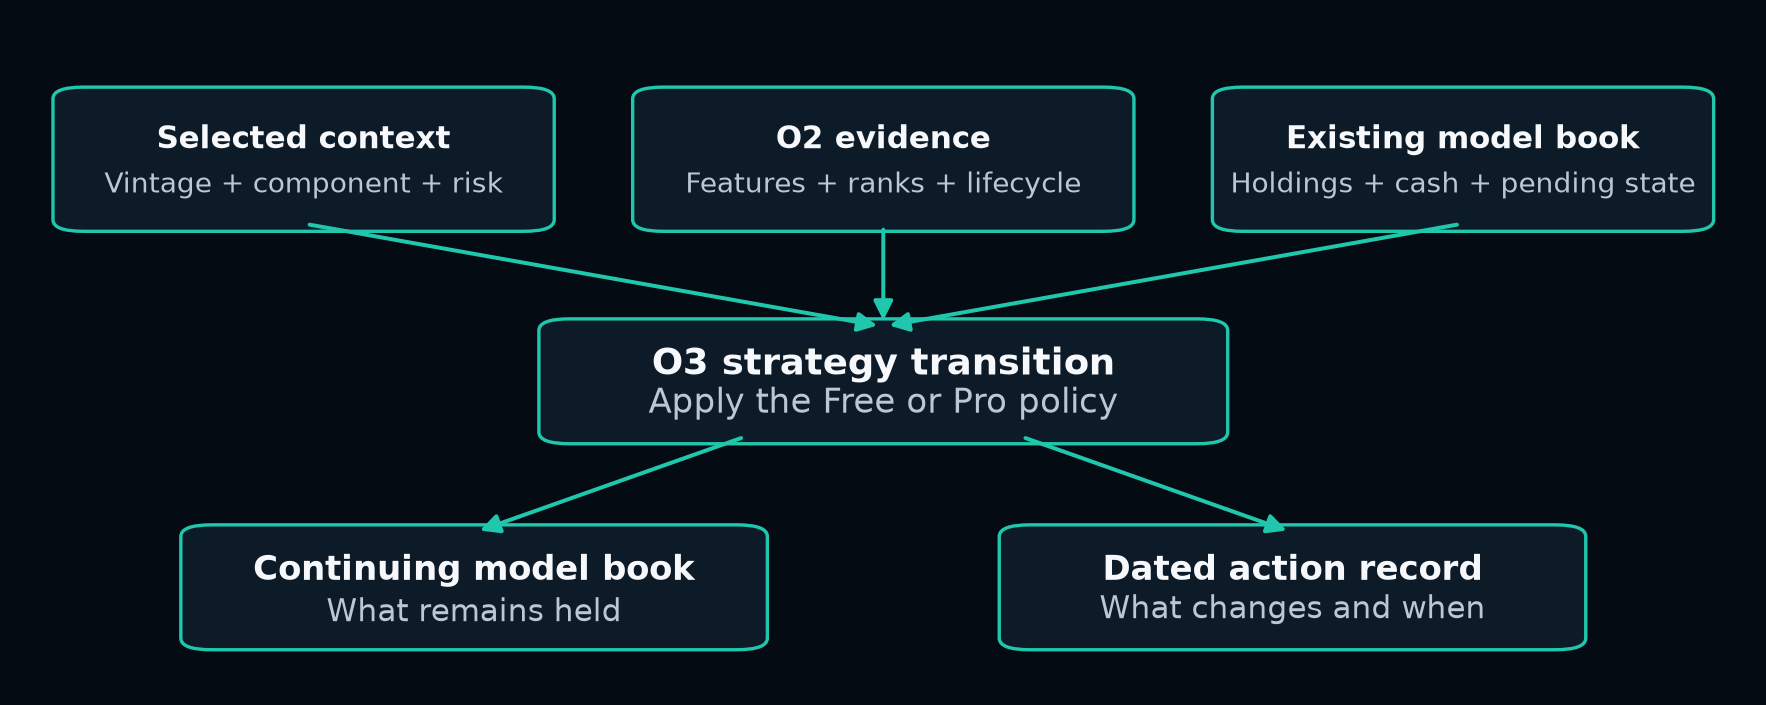
O2 updates evidence about individual securities. O3 applies the Free or Pro strategy to that evidence and its selected source context. It maintains a continuing model account rather than treating every qualifying observation as a new trade.
Figure 4. O3 consumes selected context and security evidence together with the existing model state. Its outputs include both the continuing book and the dated actions that change it.Strategy-transition notation. B^M is the model state; X is O2 evidence; V is selected vintage/universe context; Z is component and risk context; eta identifies the applicable strategy policy. A is the dated action set.
O3 responsibility
What the decision establishes
Continue the model book
Carry existing holdings, cash, lifecycle and pending obligations into the new review.
Apply the strategy policy
Resolve candidate competition, exits, admissions and exposure within the relevant Free or Pro context.
Coordinate components
Combine source-specific opportunities while maintaining a coherent model account and attribution.
Record the change
Bind the resulting holdings and actions to the completed data, strategy version and effective session.
O0 supplies relevant vintage and component selection inputs; O3 applies strategy/account policy to them. An empty action set can accompany a valid decision to retain the existing book. Selection ranks and price-driven weight changes do not themselves authorize trades.
08 / 24
SIGNAL STATE
A signal has a memory
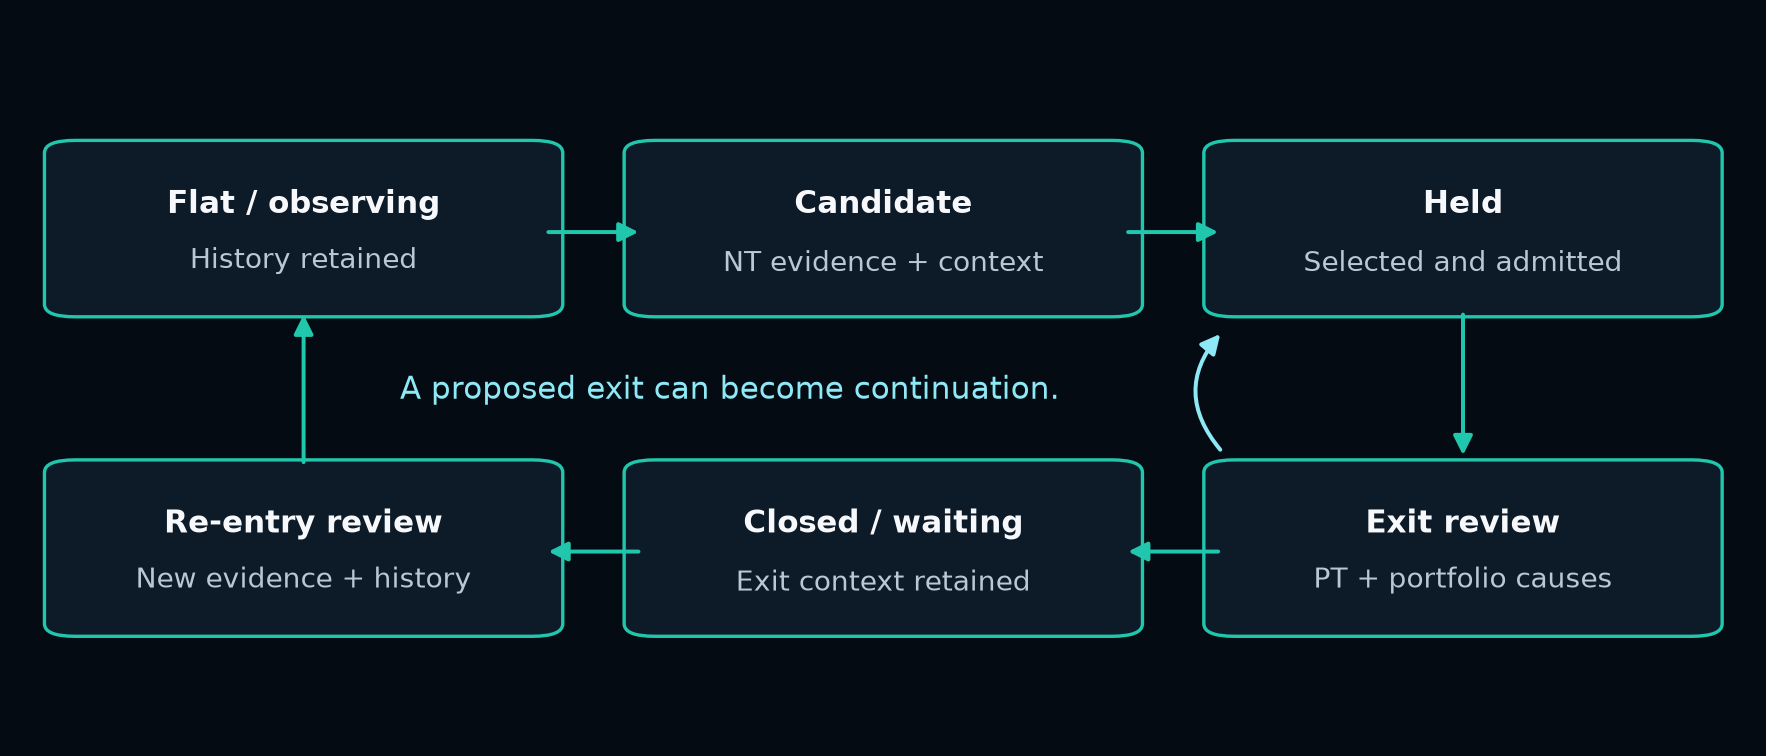
Admitted data D produce features x. Retained model history h and current evidence produce the O2 record s: lifecycle state, applicable labels and proposed security-level actions. Earlier model decisions carry into later evaluations; brokerage fills belong to the account ledger.Figure 5. A conceptual lifecycle. Entry evidence, earlier exits and later state transitions all contribute to the interpretation of the current observation.
The same price move can mean something different after a stop, a profit exit, an armed trigger or an existing position. The system therefore carries history forward. Several codes can appear together, and a later lifecycle transition can assign a code rather than simply report an independent indicator.
NT13 makes this distinction concrete: a later state branch can turn a proposed sale into continuation or a buy state. Treating all NT codes as sixteen independent entry predicates would misdescribe that behavior.
Reading the NT buy/entry signal guide
Each row describes the route’s economic or lifecycle idea and the context that distinguishes it. The explanatory headings organize the concepts; the final model decision still depends on the surrounding state and O3 policy.
The code interpretations reconcile the October 19 teaching map with the October 29 source review, including NT13’s later state assignment.
09 / 24
BUY / ENTRY SIGNALS · NT
NT1-NT8: buy/entry signals
NT codes are the buy/entry signal family. These routes evaluate whether an emerging move is credible. A qualifying signal may support a new entry or re-entry; existing state and portfolio policy still determine the model action.
Code
Explanatory concept
Idea carried by the signal
NT1
Broad momentum / inflection
Improving momentum is evaluated with structural, price and prior-state context. A turn alone is insufficient; extension and contradictory evidence can invalidate the candidate.
NT2
Aligned cycle continuation
A continuing move is evaluated against the stage of its cycle and the broader trend. Sequence and structural context distinguish alignment from a single positive reading.
NT3
Deep post-stop recovery
A recovery route tied to a qualifying earlier stop-type exit. The system reassesses a materially lower price alongside improving momentum and the retained exit state.
NT4
Low-zone recovery
Weak or oversold conditions can become a candidate when contraction, recovery and broader structure align. Low price or low oscillator strength by itself is inadequate.
NT5
Post-exit price reclaim
A prior exit creates a reference. Reclaiming that reference with supportive trend and momentum can establish a new opportunity, subject to extension and state restrictions.
NT6
Moderate-strength reference recovery
Price recovers a previously calculated reference in a moderate-strength regime. Improving momentum is evaluated together with the earlier trade and the recovery’s maturity.
NT7
Stronger-regime reference recovery
A related reclaim idea occurs in a stronger momentum/oscillator-strength configuration. Its internal dispersion and sequence context distinguish it from a generic volatility or volume breakout.
NT8
Filtered-price recovery
Recovery is assessed in a filtered price series, which can disagree with a single closing print. Its momentum and lifecycle context distinguish this route from a generic breakout.
Source basis: NT source-to-teaching review, October 19, reconciled with the more complete NT/PT source review, October 29, 2026.
10 / 24
BUY / ENTRY SIGNALS · NT
NT9-NT16: buy and continuation signals
These NT buy/entry codes describe confirmation, re-entry and continuation. Some require a recovered reference; others recognize a change to an earlier lifecycle decision. NT13 can preserve a position rather than trigger a new purchase.
Code
Explanatory concept
Idea carried by the signal
NT9
Armed-trigger confirmation
A previously armed reference must be reclaimed under suitable timing and strength conditions. This is event-specific confirmation, not simply agreement between two arbitrary indicators.
NT10
Rebound / cycle reset
Alternative recovery patterns combine momentum improvement, dispersion and oscillator-strength context. The legacy oversold/uptrend label does not describe every branch literally.
NT11
Fast post-exit turn
Recent crossings and exit timing define a rapid re-entry opportunity. A timing window means sequence state, not a calendar day or intraday appointment.
NT12
Two recovery mechanisms
Ordered momentum recovery and a distinct pullback branch share this code. The label “risk gate” does not mean portfolio sizing was approved; subtype context matters.
NT13
Continuation / position reset
A later action-state branch can reverse a proposed sale into continuation or a buy state. A locally zero entry flag does not make the code globally disabled.
NT14
Special low-zone turn
A defined low-oscillator-strength recovery pattern uses recent price and crossing context. “Override” describes a specified rule, not discretion to bypass the system.
NT15
Flat-derivative / cycle reset
An apparent loss of momentum can reset the cycle, and its interpretation depends on earlier state. Several mechanisms share the code; it is not an arbitrary indicator vote.
NT16
Established continuation
An established upward sequence with supportive momentum can qualify after the initial turn. The implementation uses calculated sequence features; candle color alone is not equivalent.
The atlas covers NT1-NT16. Other component and recovery labels retain their own definitions; the O3 strategy layer coordinates the broader model.
11 / 24
EXIT ARCHITECTURE
PT signals: reasons to sell or exit
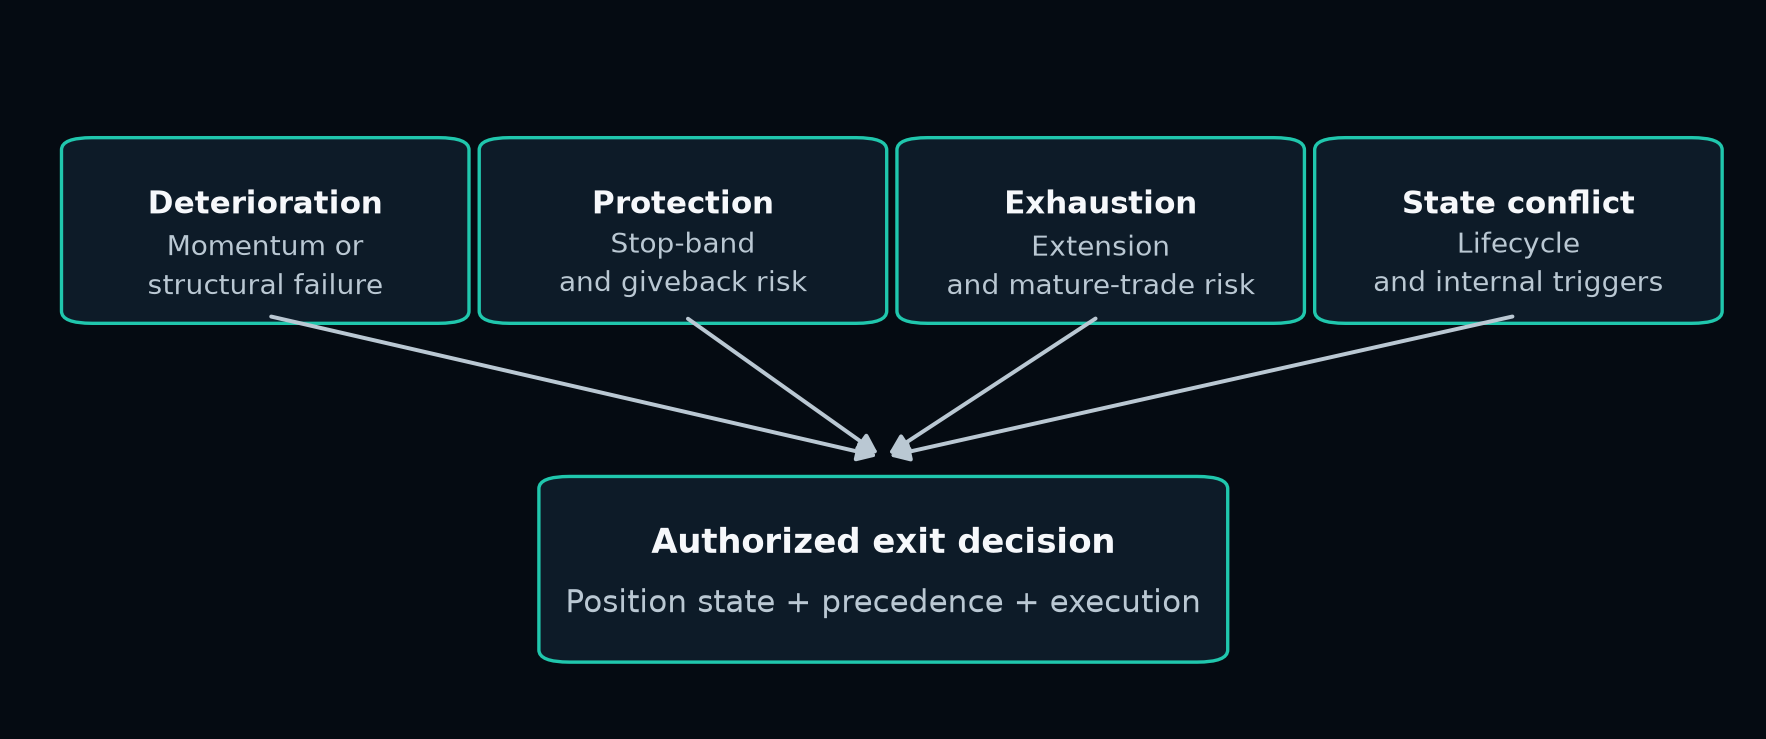
PT codes are the sell/exit signal family. They identify reasons to leave a position: weakening momentum, price protection, extension, profit giveback or a lifecycle conflict. These are not all profit-taking signals; an exit can realize a loss.
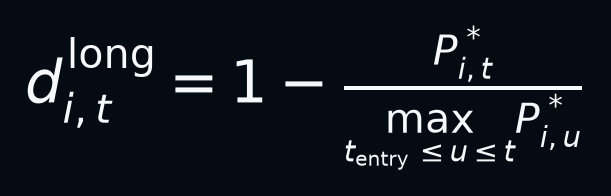
Figure 6. Overlapping exit purposes. Multiple codes and portfolio causes can contribute to one final decision.Causal exit timing. T_i contains eligible evaluation times for the current model trade; B^- is model state before the decision. Tau is the first qualifying exit time, or infinity if none occurs. Submission and fill timestamps are separate.For a long exposure, this measures the research series’ decline from its post-entry high. It is not profit relative to entry, a short-position loss measure or the account’s realized loss.
PT codes can co-fire. O3 rotation, component changes or source transitions can also produce exits. A complete explanation retains the security-level and strategy-level causes rather than assigning every sale to a single indicator.
12 / 24
SELL / EXIT SIGNALS · PT
PT1-PT10: sell/exit signals
PT1-PT10 describe sell/exit signals responding to deterioration, trade maturity or protection. Read each reason together with the position’s history.
Code
Explanatory concept
Idea carried by the exit
PT1
Momentum deterioration
Weakening momentum with oscillator-strength, entry-price and trend guards. This is a conditional deterioration exit, not a universal fixed-price stop.
PT2
Sustained cycle weakness
Established negative momentum and cycle context indicate more persistent deterioration. Its protective role differs from a sudden price-band breach.
PT3
Stop-band breach
A price-protection band marks a distinct kind of breakdown. The earlier trade and subsequent lifecycle still matter when evaluating the decision and any later re-entry.
PT4
Extension with deceleration
Overbought, overextended price accompanies slowing momentum. The concern is the fragility of a stretched move.
PT5
Extreme-state unwinding
Extreme oscillator strength/dispersion or retreat from an earlier extreme can trigger risk release. Its branches describe related but distinct conditions.
PT6
Trailing profit giveback
An established winner gives back part of its advance, with ordinary price variability taken into account. The rule’s purpose is distinct from initial trade failure.
PT7
Persistent negative sequence
Repeated negative momentum plus additional weakness indicates persistence rather than a single unfavorable bar.
PT8
Large-winner breakdown
A very large prior gain followed by moving-average deterioration motivates protection of a mature winner.
PT9
Mature profitable retracement
A profitable, aged trade weakens beneath a moving-average buffer. Trade maturity and profit context distinguish it from an initial stop.
PT10
Guarded short-cycle exit
A negative bar within a particular short-cycle configuration meets additional guards. The narrow timing context is part of its meaning.
No frequency or effectiveness is inferred from the existence of a code. A rare condition may be protective, redundant or untested; that requires complete dated evidence.
13 / 24
SELL / EXIT SIGNALS · PT
PT11-PT20: sell/exit signals
PT11-PT20 describe further sell/exit signals. Some are calculated patterns; others summarize an internal state transition. Testing requires the original episode and full portfolio path, including re-entry.
Code
Explanatory concept
Idea carried by the exit
PT11
Early failure / exhaustion
An internal composite flag includes early-trade or cycle failure and gain-exhaustion cases. Aggregating them can conceal different exit mechanisms.
PT12
Trigger / target conflict
An internal flag represents distinct trigger and entry-state conflicts. It is not another generic price stop and requires its originating subtype for diagnosis.
PT13
Recent trough pattern
A trough-related candidate pattern can form part of an exit decision. A candidate low and a confirmed low differ; the necessary observation sequence matters.
PT14
Peak / profit reversal
A peak-related reversal trigger applies subject to entry-type protections. The stored peak event and the trade’s origin matter.
PT15
Rapid gain / flat momentum
Rapid appreciation or extension, or a separate flat-momentum profit condition, can motivate release. A shared code does not imply identical paths.
PT16
Profitable overbought reversal
An overbought profitable trade shows reversal or deceleration. The purpose is protection as a strong move loses support.
PT17
Mature extension release
A sufficiently mature and overextended trade can release profit. Maturity distinguishes the condition from immediate early-trade failure.
A relatively young trade has reached a large profit condition measured with volatility context. It addresses a fast advance’s concentration of risk.
PT20
Mature gain giveback
The exit combines trade maturity, a qualifying retained gain and weakening momentum. Its purpose must be evaluated in the complete trade and portfolio path.
The source review did not establish independent frequency or effectiveness for every code. These descriptions explain intent; effectiveness requires a complete dated portfolio test.
14 / 24
WAVE STRUCTURE
Wave structure and momentum
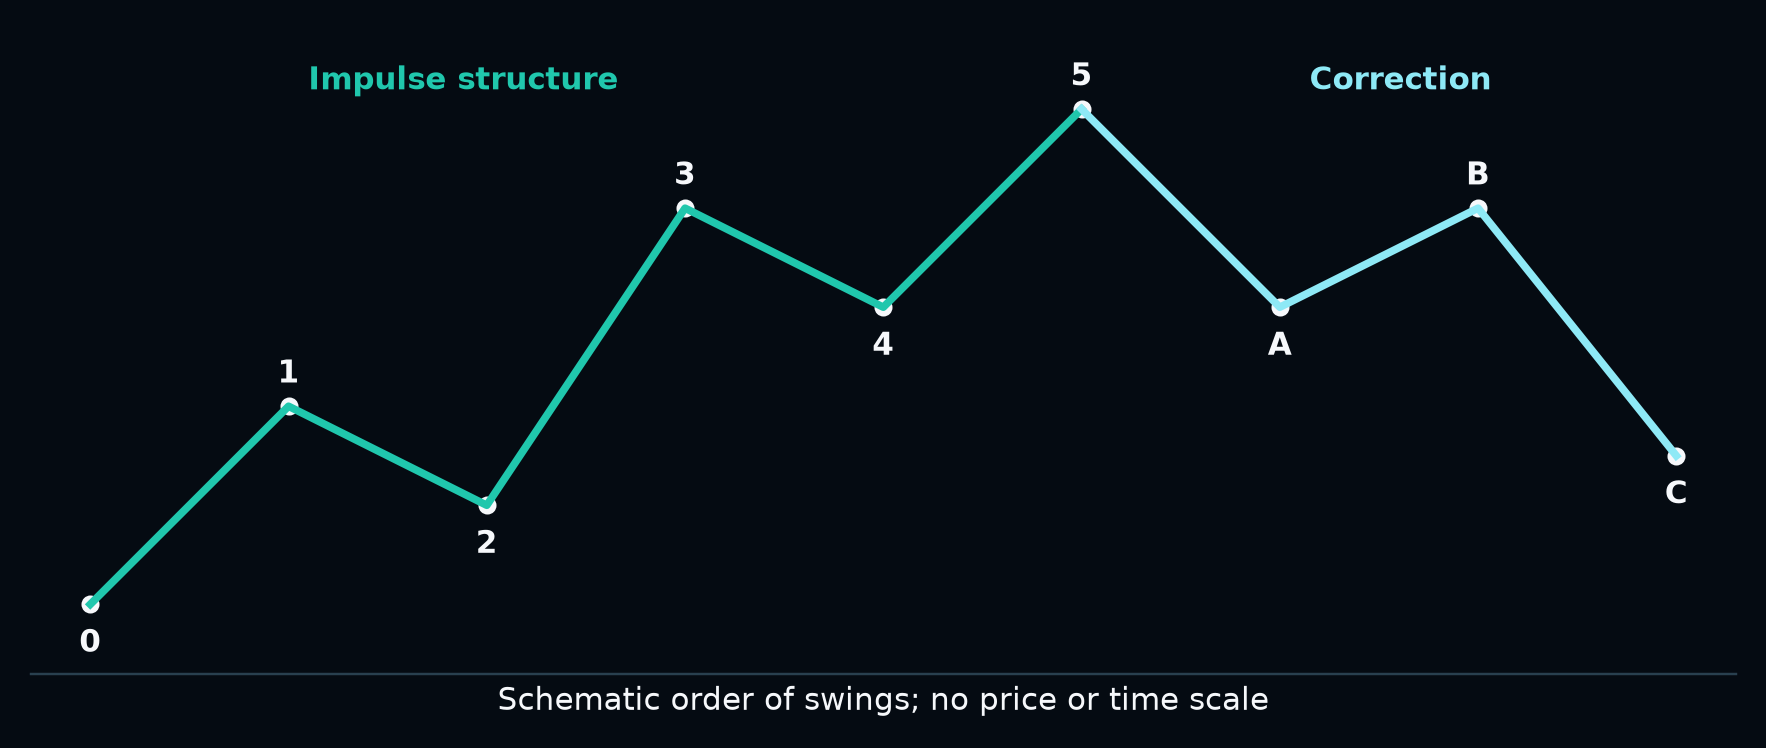
Elliott-wave analysis describes motive and corrective structures. Its familiar five-part impulse and three-part correction provide a vocabulary for advances, retracements, renewed movement and exhaustion [4]. That vocabulary connects naturally to questions about acceleration, recovery and maturity.
Figure 7. Textbook-style swing schematic. The drawing illustrates impulse and correction; it has no market price, time scale or forecast attached.
Convert the picture into observable questions
Wave idea
Question for a systematic review
Impulse
Is directional movement persistent, and is its strength increasing or fading?
Correction
How far has price retraced, over what duration, and has the broader structure survived?
Renewed advance
Has price reclaimed a relevant reference with supporting momentum and lifecycle context?
Exhaustion
Does a new extreme have weaker support, or has a mature trade begun to surrender its gain?
Confirmed swing endpoints allow amplitude, duration and average slope to be measured. The operational requirement is to date a pivot when enough information existed to recognize it. A retrospective label can be useful for description while being unavailable to a live decision.
Here wave structure is an interpretive framework. The inspected MI records establish cycle, crossing, peak/trough and recovery concepts; they do not establish a literal live 1-5 / A-B-C counter. Competing counts and unclassified states remain possible.
15 / 24
VINTAGES
Preserve cohorts, then compare them
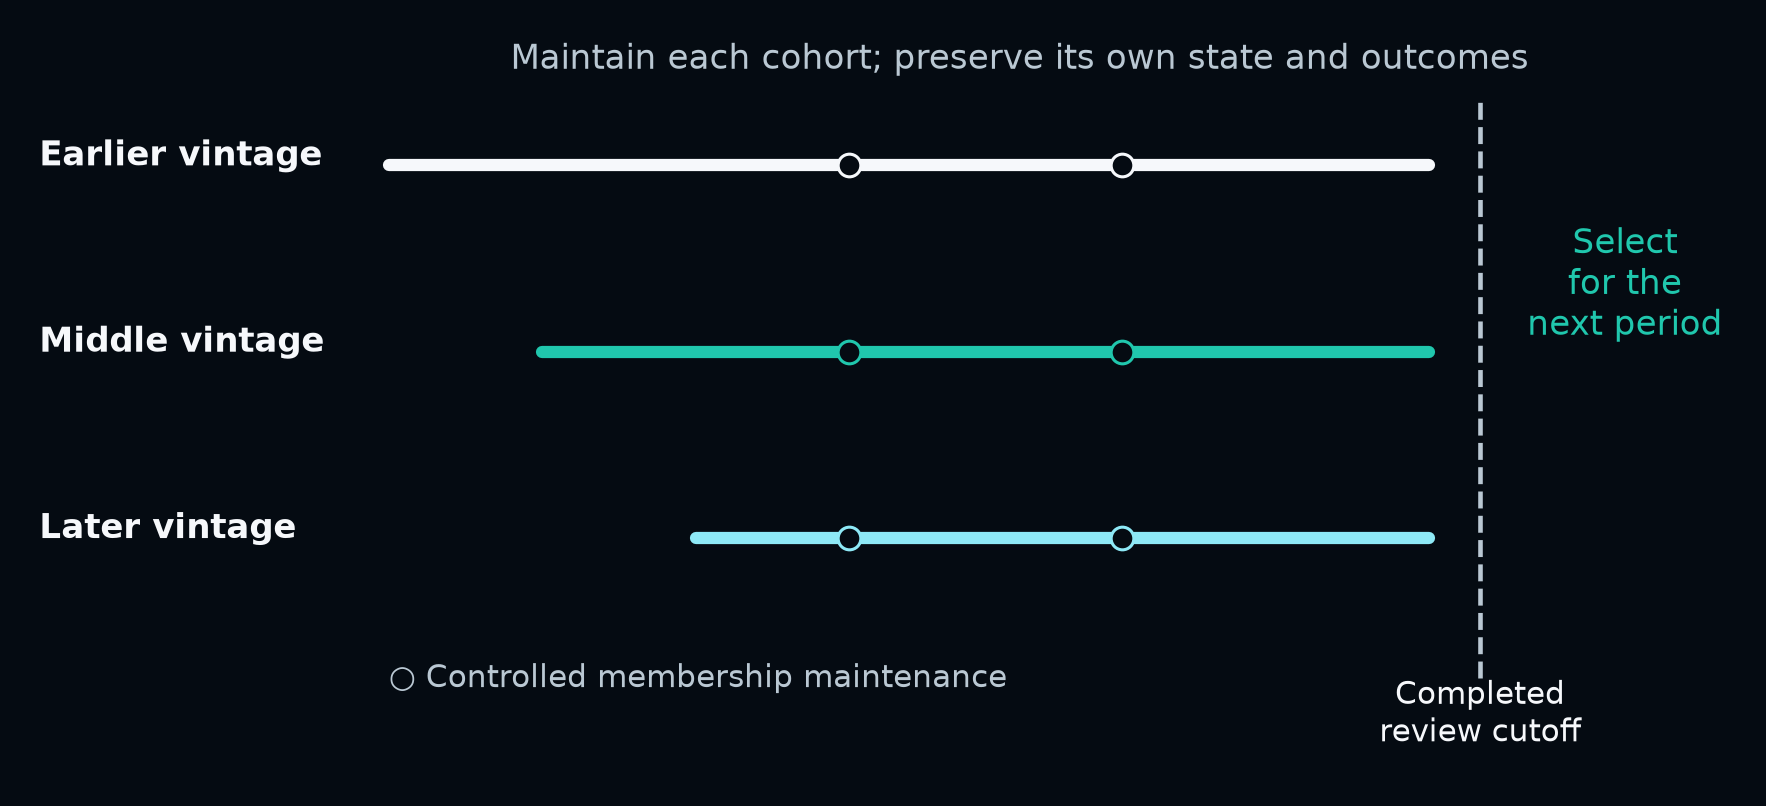
A vintage is a dated universe cohort with its own continuing history. In the inspected MI design, cohorts are formed from information available at a completed formation cutoff and maintained under controlled rules. A monthly selection decision chooses among eligible continuing cohorts; it does not recreate the past using the month’s winning stocks.
Figure 8. Cohort persistence and later selection. The schematic separates cohort maintenance from comparison at a later completed cutoff.j indexes maintenance events and m completed monthly selection cutoffs. Eligible vintages form V_m; their completed outcome/risk records R inform the next-period source. O0 supplies that selection context to O3.
The source architecture compares completed outcomes with downside and drawdown context and includes persistence in switching. This addresses two competing costs: staying with a weakening opportunity set and switching too quickly after noise. It does not guarantee that the selected vintage will lead next period.
Formation rank, current within-vintage trade rank and portfolio holding weight are different measurements. Vintages also overlap; ten related cohorts are not ten independent experiments. Free and Pro histories must preserve their own actual policy identity.
16 / 24
O3 | ROTATION
O3: rotation and strategy components
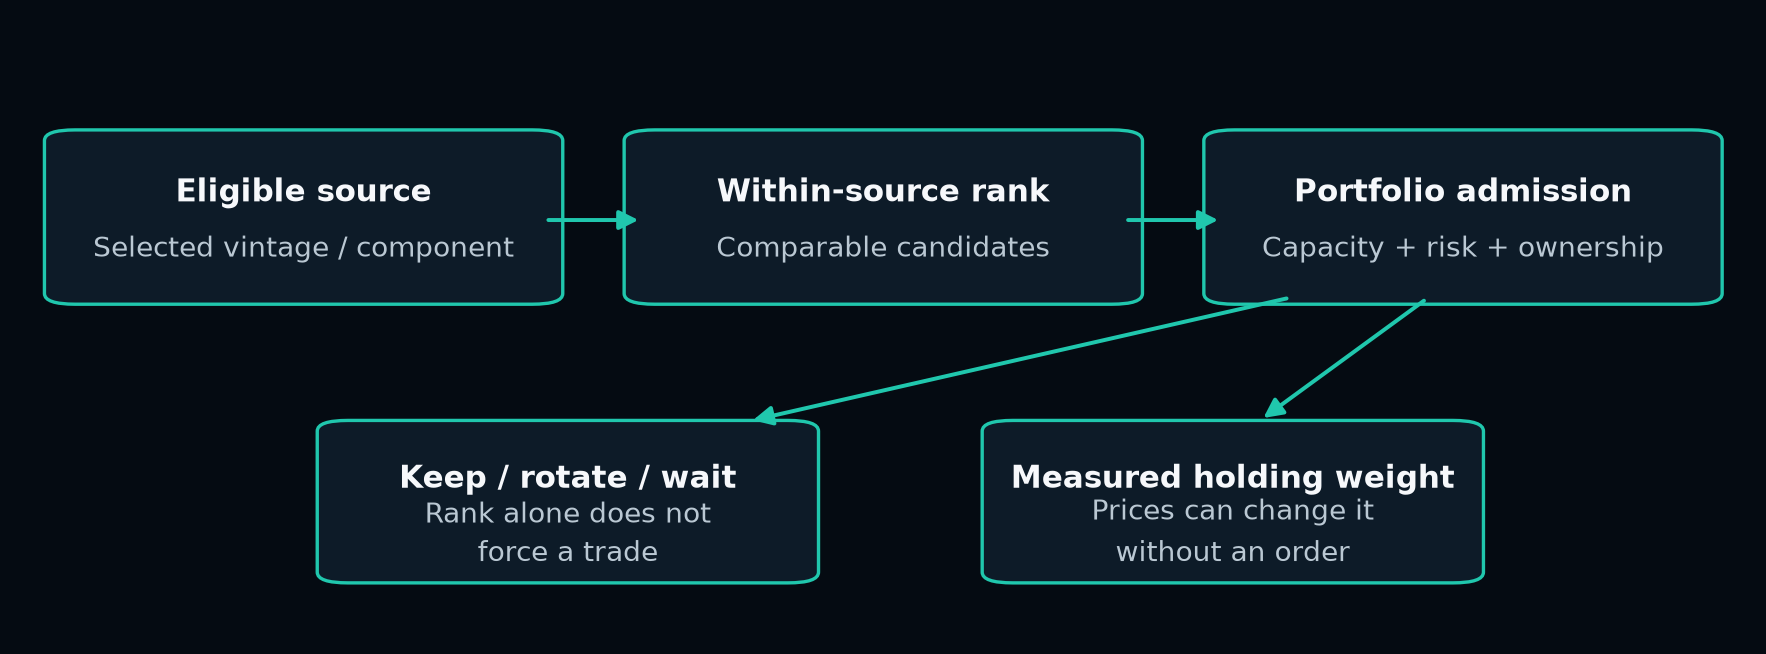
Figure 9. Selection context, within-source rank and O3 admission answer different questions. A measured holding weight can change without a trade.
Rotation asks what should remain, leave or enter the model book. A promising security can wait because another candidate has priority or capacity is unavailable. A holding can exit through its own lifecycle or a strategy-level change.
Strategy view
How to interpret it
Free
A weekly long-stock rotation model with its own selected research and policy. An addition need not coincide with a fresh daily NT code.
Pro
MI core and additional long/short component families. Core, Trend and Short are reader-facing labels, each with its own research context.
Across components
Ranks retain their source scope; shared securities, opposing exposures and capital must reconcile into one coherent model account.
Weight drift is different from trading
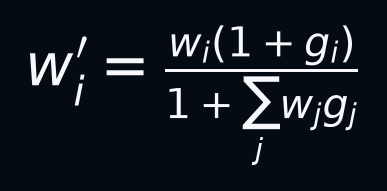
Fixed-share illustration: g_i is a simple price return. Cash earns zero; there are no trades, flows, fees or distributions, and ending equity is positive. The denominator is ending equity divided by starting equity.
Even with unchanged share quantities, relative price moves change holding weights. O3’s dated action record establishes what the strategy requested; displayed weight differences do not by themselves create rebalancing instructions.
The strategy also considers existing ownership, exposure, concentration and turnover under its policy. Core/Trend/Short labels and weight reporting are documented in deployed reader material [5,8].
17 / 24
PORTFOLIO ACCOUNTING
One account, one coherent ledger
Equity and signed weights, for positive equity E. C includes recognized cash, liabilities and accruals consistently; q is negative for shorts. Model and brokerage ledgers use their own records.Cash identity, gross exposure G and net exposure N. Short-sale proceeds do not automatically represent freely available spending capacity.
Several strategy components can refer to the same security. Their economic exposures must be reconciled with cash and position constraints. Adding independently capitalized component returns is not necessarily the return of an executable combined account.
Per-fill accounting over a chosen interval. Each fill f has security i_f, signed quantity change, price P_f and explicit charge K_f. Corporate actions, financing, borrow and external cash flows enter as separate ledger events.
Model prices and realized costs
Slippage compares an execution benchmark with the actual fill using a consistent side convention. A simulation that already uses slipped prices should not subtract the same slippage again. Commissions, spreads, borrow, financing, taxes and subscriptions require explicit treatment in any performance calculation.
Stops can gap, limit orders can remain open and shorts can be unavailable. Account size, whole-share rules and activation history can prevent replication of model weights. Actual-account constraints therefore remain part of execution even when the strategy decision is complete.
The dated owner workflow uses current-equity sizing, no cash borrowing, no automatic rebalancing or catch-up bootstrap, and ownership-limited exits. These controls describe that account workflow, not every possible implementation.
18 / 24
NEWSLETTERS | RESEARCH COMMUNICATION
Newsletters carry the decision
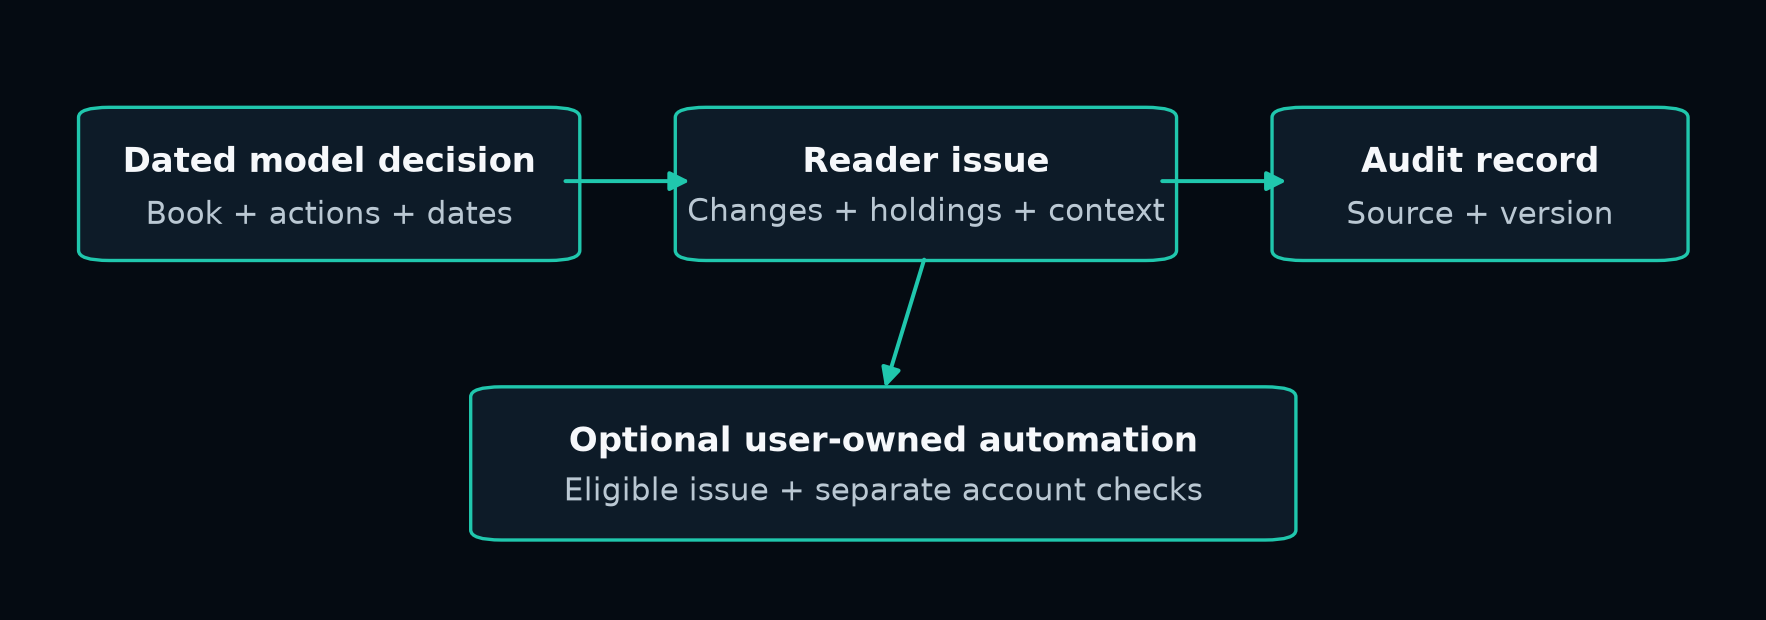
Each issue explains what changed, what remains held, why the model acted and when it applies. New actions, current holdings and historical records answer different questions and are shown separately.
Figure 10. One dated decision source supports the reader issue and its audit record. Optional automation uses an eligible published issue and adds account-specific execution checks.
Reader issue
Cadence and purpose
Free
Thursday-close research delivered Friday. Weekly stock rotation, additions, removals, current holdings and risk context.
Pro
Daily research, with applicable buys, sells, shorts and covers; holdings, strategy context and reference ranks. Core, Trend and Short preserve their source meaning.
The information that travels with a decision
The research cutoff, signal date, expected trade session, action, reason and applicable sizing stay together. Holding weight describes model size; rank orders names within a research scope. Existing holdings provide history rather than a catch-up instruction.
A completed no-change issue retains the current book. A deferred issue preserves the true source date and identifies what could not be established. An unavailable calculation is not a fresh no-trade decision.
Current cadence, issue structure and product distinctions were checked against the MI homepage, newsletter guide and automation guide on November 5, 2026 [5,6,8].
19 / 24
LIVE EXECUTION
Live execution and reconciliation
Figure 11. Two execution paths. The owner workflow consumes authenticated strategy evidence; optional subscriber setups read eligible published issues. Each account maintains its own authority, orders and fills.
The daily workflow checks whether the required market observations have completed before advancing the strategy. Different research inputs may have different completion checks. It restores authenticated state, advances O0-O3 and retains the true data cutoff. Readiness and recovery are bounded, and a processing start does not promise a newsletter arrival or an execution time.
Eligibility is checked again at execution
The execution process binds the strategy version and decision source to an eligible session, confirms account authorization and security identity, then checks cash, limits and strategy-owned positions. A model cover cannot close a short that the account never held. A missed action window is not permission to chase the trade later.
Submission and reconciliation
Each economic action is linked to a durable event record before submission. After a broker response, the workflow reconciles order status, fill activities, positions and its ledger. A partial fill remains partial; an uncertain submission is investigated before any replacement send.
The dated example uses the publisher’s separately authorized Alpaca account. Readers control their own optional setups. The public guide supports eligible U.S. equity actions; it does not establish execution of every model exposure or a fresh subscriber’s complete scheduled live order-and-fill cycle [6].
20 / 24
LIVE EVIDENCE
A live recovery, reconciled
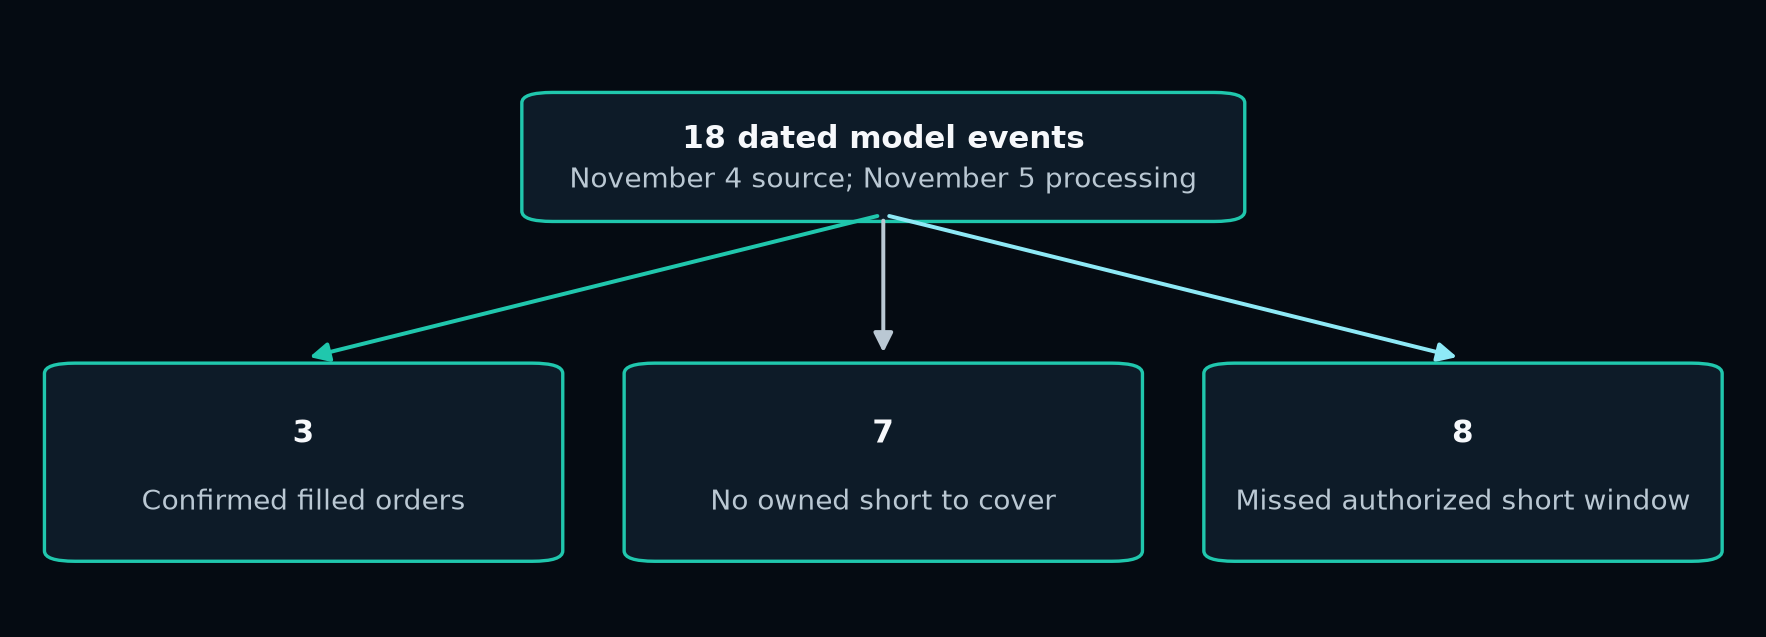
Figure 12. Operational snapshot: November 5, 2026, 13:34 EST; source completed session November 4. Counts describe execution disposition, not investment returns or profitable trades.
The strategy had completed and its dated decisions already existed. The retained task log recorded completion, but the expected completion record was unavailable and the original exit status could no longer be retrieved. A separate verification authenticated the saved checkpoint and generated new completion evidence before execution continued. No new signal calculation or newsletter resend was required.
The reviewed summary contained 18 events: three mapped to filled orders, seven covers had no strategy-owned short to close, and eight short entries were excluded because their authorized next-open window had passed. Broker order statuses and summed fill activities agreed with the three filled-order records.
What the example demonstrates
A completed strategy calculation, a delivered issue and an executable account action are distinct facts. The account’s ownership and action windows determine which decisions can be implemented. Successful recovery means preserving that distinction and reconciling the outcome, including legitimate exclusions.
Evidence: November 5 saved execution summary, broker verification and recovery record. Account identifiers and security-level account details are excluded from this presentation. Public automation offers separate user-owned Paper and Live setups with its own documented verification limits [6].
21 / 24
VALIDATION
Test the whole decision process
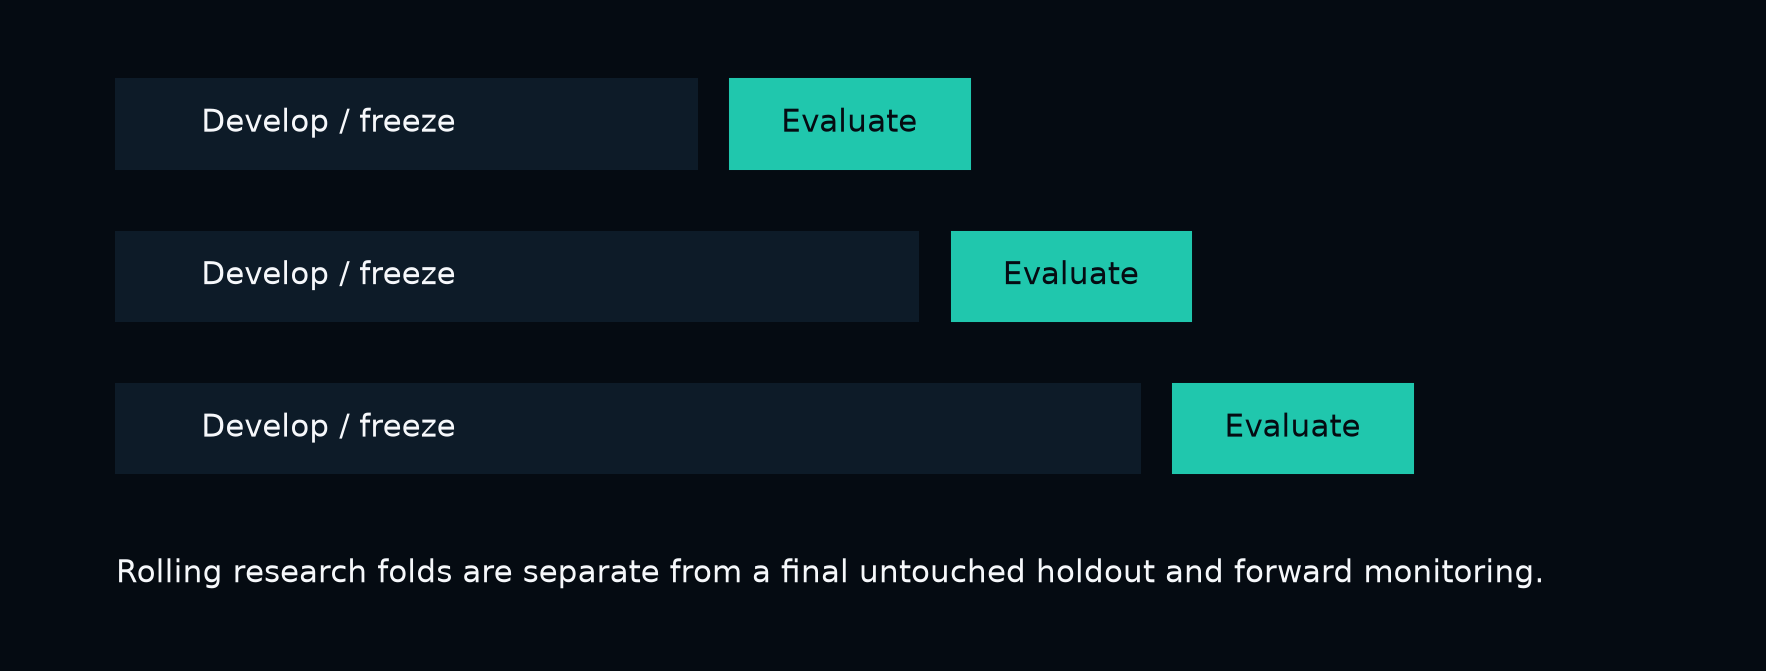
An individual entry can look attractive while degrading the portfolio. An exit delay can improve its isolated sale price while using cash longer, changing the next entry or altering a future vintage choice. The relevant test is the complete causal path after implementable costs.
Figure 13. Schematic rolling evaluation. Training, rule selection and evaluation windows must respect time, overlapping labels and the information actually available.Choose rules from evidence available and outcomes completed by T_k, then freeze them through the next evaluation segment. Record the variants tried and selection procedure. The protocol applies to hand-designed rules and fitted models.
The minimum credible evidence package
Dimension
Evidence required
Data and causality
Point-in-time identity, exclusions, availability timestamps, adjustment treatment and no future-assisted features.
Portfolio economics
One coherent account; costs; cash and short constraints; no synthetic multiplication of component capital.
Robustness
Losing regimes, counterexamples, parameter sensitivity, component ablations and dependence-aware uncertainty.
Selection discipline
Record all tried variants; preserve an untouched holdout where feasible; report when it does not exist.
Operations
Replay/restart parity, stale-data behavior, duplicate-send protection and reconciliation under partial or uncertain fills.
Repeatedly selecting the best backtest can overstate expected performance; Bailey and colleagues formalize this overfitting problem [7]. Validation must include the selection process itself. An explanatory equation or a large code catalog is not statistical evidence of an edge.
22 / 24
OPERATING PRINCIPLES
Five invariants of a running strategy
The practical test of a systematic process is whether its relationships remain coherent when data changes, sessions advance, a task restarts or the broker responds incompletely. These five invariants connect the mathematical model to everyday operation.
Invariant
Why it matters
Causal information
Every decision uses observations available by its cutoff. Future-confirmed pivots, revised histories and incomplete bars cannot silently improve an earlier decision.
Continuing state
A restart preserves the strategy’s actual preceding state, including holdings, prior exits and pending obligations. It does not create a new hypothetical beginning.
Bound decisions
The model book, action record and newsletter agree on their source, strategy version and dates. Rendering or commentary cannot invent an economic action.
Account ownership
Execution uses actual account capacity and strategy-owned positions. A model holding or changed weight is not enough to create a catch-up or resize order.
Reconciled outcomes
Submitted, partially filled, filled, excluded and unresolved actions remain distinct. Ambiguous responses are reconciled before another submission.
No change is a valid result
A completed review may retain every holding. That is a dated strategy decision. A deferred calculation, stale observation or unavailable account check is a different state and needs a different explanation. Treating both as “nothing happened” would lose the information needed to operate the system.
Evaluate the strategy as a whole
Signal quality, portfolio economics, delivery reliability and execution fidelity are related but separately measured. A better isolated exit price may worsen a later opportunity; a clear newsletter does not guarantee a fill; a reliable execution process does not establish profitable performance. Each claim needs the evidence appropriate to it.
[3] Daniel, K. and Moskowitz, T. (2016). Momentum Crashes. Journal of Financial Economics 122(2), 221-247. NBER working-paper record and published-version citation. https://www.nber.org/papers/w20439
[5] Mount Inflection. Current newsletter description and dated October 30 Free issue, based on October 29 research. Accessed November 5, 2026. https://mountinflection.com/
[6] Mount Inflection. Newsletter Automation Setup. Current setup scope and verification qualifications. Accessed November 5, 2026. https://mountinflection.com/automation
[8] Mount Inflection. How the Stock Strategy Newsletters Work. Current cadence, issue content, dates and holdings. Accessed November 5, 2026. https://mountinflection.com/how-it-works
Research and operating records
The NT/PT interpretation reconciles the October 19 teaching map with the October 29 source review. Architecture descriptions draw on stage contracts, strategy continuation modules and dated deployment records, using the current Free/Pro product scope. The November 5 recovery example is bound to saved execution, fill and state-verification records.
Mathematics and figures
Equations use standard definitions and conceptual state/accounting relationships. The analytic momentum curve and Elliott-style wave drawing illustrate mechanisms; they are not market observations or forecasts. The event-reconciliation diagram uses verified operational counts. No investment-performance series is presented.
Dated operating observations establish the recorded outcome at that time. The code atlas does not establish that every code is active or frequent in every component. The wave discussion is interpretive; a canonical MI wave-counting engine was not established by the inspected records.
 Mount Inflection